|
| A TIME FOR BUBBLY OR IS RIVERSIDE IN A BUBBLE? |
 |
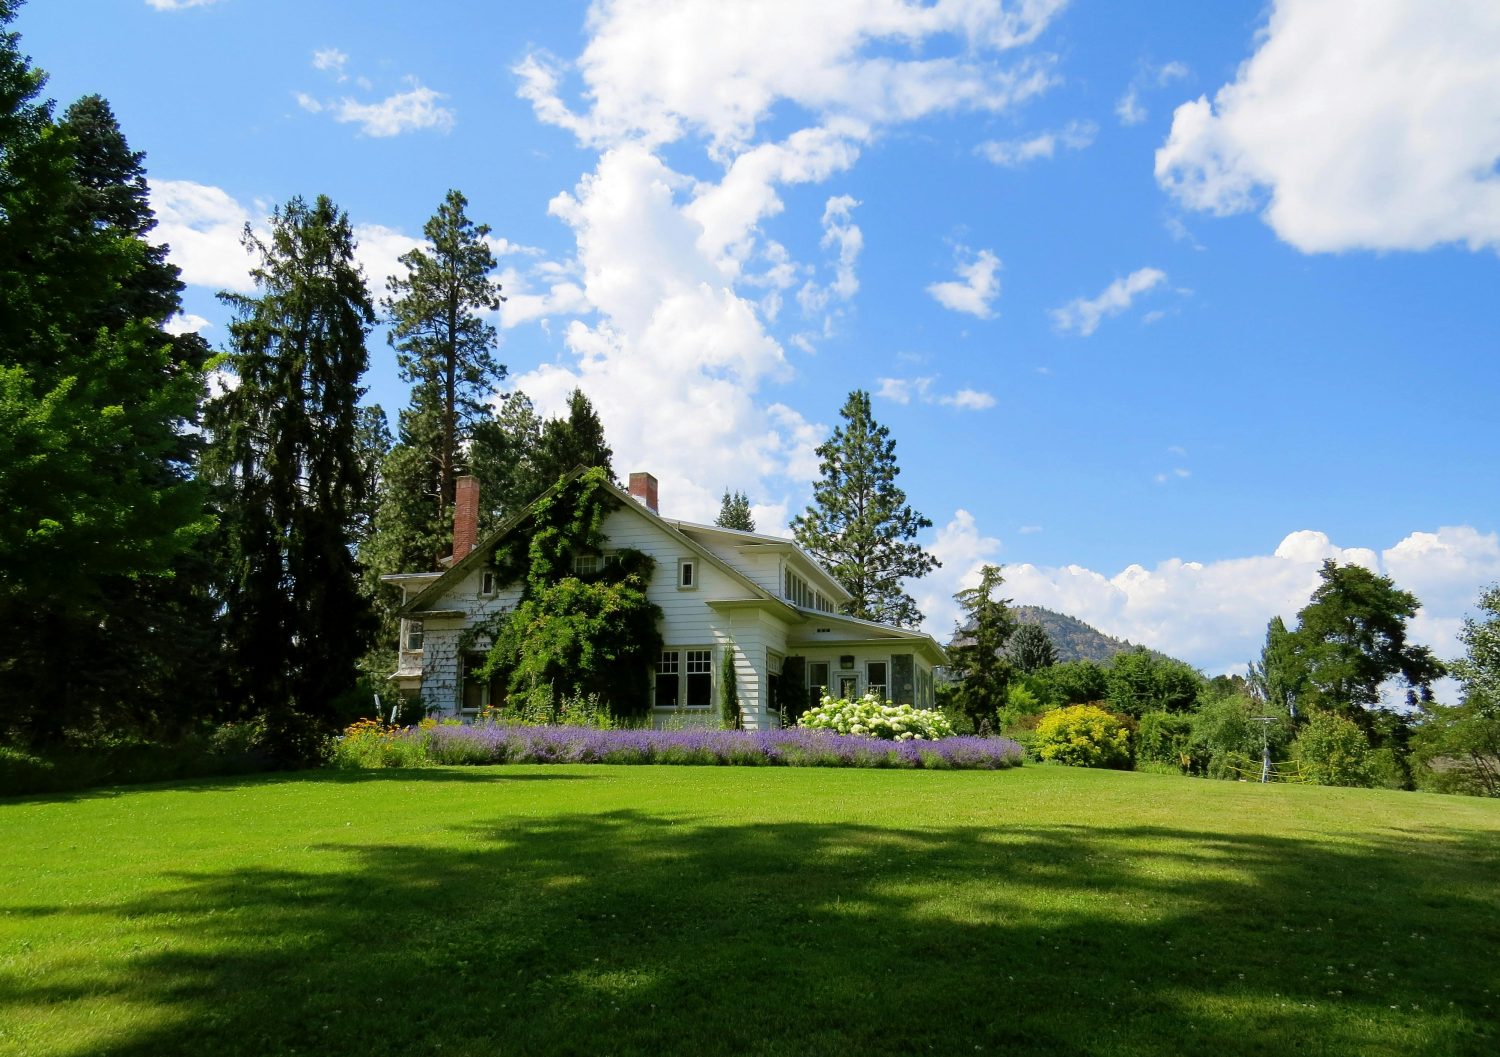
| 32 WELWYN RD – RIVERSIDE – SOLD YESTERDAY $2,150,000 |
 |
| EVERYTHING IS COMPACT – GALLEY KITCHEN |
 |
| GRAY – PEPPERED WITH BLUE &YELLOW (WHAT A SURPRISE :-))) |
After seeing this sale of 32 Welwyn Rd. Riverside yesterday, which closed at $2,150,000 – I wanted to look at the numbers historically since 2003 for the 1st quarter to see how we are trending. It’s even more dramatic to see data for all months for years prior to 2014, but apples to apples – for comparison, we are looking at the 1st quarter.
The sellers bought this property in 2006 for $1,975,000 – and I’m sure that they were fretting when prices were in the hopper. But lookeee here – they came out ahead – hands to the ceiling!
The numbers below are median prices. The Blue line is an average of the median prices. There is a bit of an anomaly in 2009 – which was obviously skewed by a $10M sale in January – otherwise, it looks like this is the year to sell your home in Riverside. Sell in Riverside, and buy in Mid or Back Country…eventually the estate area will have it’s day once again – and you may even be a tad late for mid-country.
table { }td { padding-top: 1px; padding-right: 1px; padding-left: 1px; color: black; font-size: 12pt; font-weight: 400; font-style: normal; text-decoration: none; font-family: Calibri,sans-serif; vertical-align: bottom; border: medium none; white-space: nowrap; }.xl63 { border: 0.5pt solid windowtext; }.xl64 { font-size: 11pt; font-family: Calibri; border: 0.5pt solid windowtext; }.xl65 { font-size: 11pt; font-weight: 700; font-family: Calibri; border: 0.5pt solid windowtext; }.xl66 { font-size: 11pt; font-family: Calibri; border: 0.5pt solid windowtext; }.xl67 { font-size: 11pt; font-weight: 700; font-family: Calibri; background: none repeat scroll 0% 0% rgb(197, 217, 241); }.xl68 { font-size: 11pt; font-family: Calibri; background: none repeat scroll 0% 0% rgb(197, 217, 241); }.xl69 { background: none repeat scroll 0% 0% rgb(197, 217, 241); }.xl70 { font-size: 11pt; font-weight: 700; font-family: Calibri; background: none repeat scroll 0% 0% white; }.xl71 { font-size: 11pt; font-family: Calibri; background: none repeat scroll 0% 0% white; }
| JANUARY |
2014 |
2013 |
2012 |
| FEBRUARY |
$2,200,000 |
$1,162,500 |
$2,250,000 |
| MARCH |
$3,850,000 |
$2,714,810 |
$3,172,500 |
| |
$2,950,000 |
$1,135,000 |
$1,105,000 |
| |
$3,000,000 |
$1,670,770 |
$2,175,833 |
| |
|
|
|
| |
2011 |
2010 |
2009 |
| JANUARY |
$4,000,000 |
$1,572,500 |
$10,000,000 |
| FEBRUARY |
$600,000 |
$1,600,000 |
|
| MARCH |
$907,500 |
$1,400,000 |
$750,000 |
| |
$1,835,833 |
$1,524,167 |
$5,375,000 |
| |
|
|
|
| JANUARY |
2008 |
2007 |
2006 |
| FEBRUARY |
$3,026,500 |
$1,822,500 |
$1,623,000 |
| MARCH |
$1,350,000 |
$1,617,500 |
$1,800,000 |
| |
$2,875,000 |
$2,577,500 |
$1,105,000 |
| |
$2,417,167 |
$2,005,833 |
$1,509,333 |
| |
|
|
|
| JANUARY |
2005 |
2004 |
2003 |
| FEBRUARY |
$1,747,500 |
$1,425,000 |
$1,035,500 |
| MARCH |
$2,407,750 |
$2,450,000 |
$1,002,500 |
| |
$1,305,000 |
$1,600,000 |
$1,262,500 |
| |
$1,820,083 |
$1,825,000 |
$1,100,167 |
Like this:
Like Loading...
Related